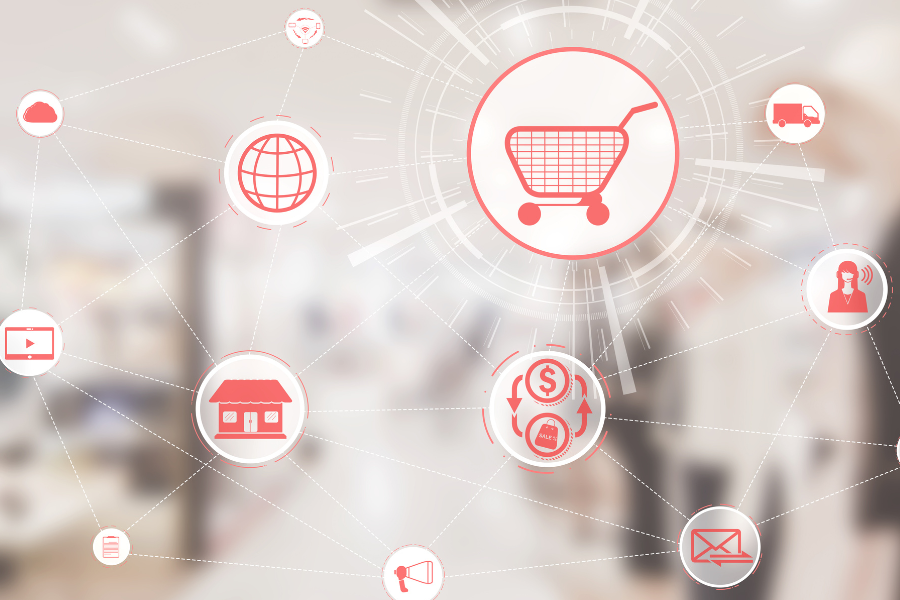
Imagine stepping into a store where every choice, from how products are displayed to the special offers available, is informed by real-time data. This is the advantage of visualization tools in retail. These tools enable retail managers, store owners, and marketers to transform complex data, including customer insights, into straightforward visuals—like charts and graphs—allowing for quicker, smarter decision-making and improved customer engagement. Let’s learn Visualization Tools for Retail.
So, why should this matter to you? Whether you’re a marketing manager, sales manager, store manager, or business owner, grasping your customers’ shopping habits is essential for increasing sales. Visualization tools convert numbers into visuals, making it easier to identify trends, comprehend customer behavior, and make informed decisions that enhance your business.

Top Data Visualization Tools for Retail
Choosing the right data visualization tool can be a daunting task with so many options available. But don’t worry—I’m here to help. Here are some of the top retail analytics tools that can assist you in visualizing data and transforming it into actionable insights using advanced data visualization software:
Tableau: Renowned for its intuitive interface, Tableau allows you to create stunning charts and dashboards. It’s excellent for identifying trends and patterns in customer behavior.
Power BI: This Microsoft tool integrates seamlessly with other Microsoft products. It’s ideal for those looking to explore sales data in depth and generate custom reports.
Qlik Sense: Qlik Sense provides robust analytics capabilities with user-friendly drag-and-drop features that simplify data visualization. It’s perfect for retail managers who want to grasp the “why” behind the data.
Looker: Looker is tailored for businesses aiming to foster a data-driven culture. It enables you to create reports that are easily understandable and usable by everyone on your team.
These tools are accessible to more than just tech experts—they’re designed for anyone eager to make informed decisions based on data.

How to Choose the Right Tool
Choosing the right tool hinges on your specific needs. Here’s a straightforward guide to assist you in making a decision:
Define Your Objectives: Are you aiming to boost sales, enhance inventory management, or analyze data to improve customer experience? Clarifying your objectives will guide you in selecting the appropriate tool. For instance, Google Analytics can provide insights into customer behavior and trends by transforming extensive sales and customer data into visual representations.
Evaluate Your Team: If your team lacks technical expertise, opt for a tool that is user-friendly. Tableau and Qlik Sense are recognized for their intuitive interfaces.
Consider Your Budget: Some tools, such as Power BI, offer free versions with limited features, while others may necessitate a larger financial commitment.
Case Study: Sarah, a store manager in Singapore, was curious about the poor sales of certain products. By utilizing Tableau, she found that these items were often obscured by more popular ones. After rearranging her store layout, she saw a 15% increase in sales within just one month. If you want to enhance your knowledge of retail data analysis, take a look at our Data Analytics for Retail Store Management Course.
Benefits of Visualization Tools in Retail
Using data visualization in retail provides numerous advantages:
Improved Decision-Making: Clear visuals enable you to quickly pinpoint what’s effective and what isn’t. Interactive dashboards let you track sales trends and customer behavior in real-time, resulting in better decisions that can positively influence your business.
Enhanced Customer Experience: By analyzing shopping patterns, you can customize the shopping experience to align with customer preferences, resulting in more satisfied customers and increased sales. Furthermore, these insights can aid in crafting personalized marketing strategies, which help build customer loyalty and satisfaction.
Time Savings: Visualization tools help you save time by displaying data in an easily digestible format, allowing for quicker decision-making.
Consider how much time you could save by having all your sales data consolidated into one straightforward dashboard. No more guesswork—just clear, actionable insights.
If you’re interested in improving your store layout and customer journey, our Visual Merchandising course could be exactly what you need.

Integration with Retail Analytics for Sales Data
One of the key benefits of these tools is their ability to integrate with your current systems in the retail sector. Whether you’re already utilizing retail analytics software or just starting out, visualization tools can significantly boost your capabilities.
For instance, if you’re using a point-of-sale system, a tool like Power BI can directly access that data, analyzing it to create real-time dashboards that provide insights into your store’s performance. This integration enables smooth analysis without the hassle of switching between various software applications.
Interested in discovering how data analysis can further enhance your retail business? Our Data Analysis for Retail course explores how you can use data to foster growth.
Future Trends in Retail Data Visualization Tools
As technology progresses, visualization tools are also evolving. Here are some key trends to keep an eye on:
AI-Driven Insights: These tools will soon go beyond merely displaying data—they’ll provide actionable recommendations based on that data. In a changing retail environment, these insights will not only support better decision-making but also boost operational efficiency by streamlining processes and optimizing store layouts.
Mobile Accessibility: Retail managers will have the ability to access their dashboards while on the move, enabling them to make real-time decisions from any location.
Enhanced Personalization: Tools will deliver more tailored insights, allowing you to customize your store to better meet the unique needs of your customers.
By staying ahead of these trends, you can ensure that your retail business continues to succeed in a constantly changing market.
Conclusion: Take the Next Step
Visualization tools have become essential for any retail business aiming for success. By transforming complex data into easy-to-understand visuals, these tools enable you to make quicker, more informed decisions that can increase sales and improve customer experience.
Are you prepared to elevate your retail business? Think about signing up for one of our digital marketing courses in Singapore to discover how to use these tools effectively. Your path to retail excellence begins now!


